
New grant will add pressure for charge point growth
And four other insights from my analysis of the latest DfT charge point data

Hello, I’m Tom Riley, and welcome back to The Fast Charge, a British EV newsletter. This edition is free to all, so enjoy!
In today’s edition… Yesterday, the Department for Transport published the latest official charge point data for the UK. I share my top five insights, including predictions of how the new EV grant may put new pressure on networks to grow even faster.
There’s no latest news section this week, but I promise a bumper recap this coming Wednesday to make up for it.
As ever, if you have any comments or feedback, please reply to this email or message me on LinkedIn.
My top five insights based on DfT’s new charging data
Summary: Yesterday (24 July), the Department for Transport published the latest batch of quarterly charge point statistics. They revealed the network had grown by 27% since 2024, taking the number of publicly available chargers up to 82,002 in total. You can find the summary here, and a press release by DfT here.
Fresh insights… I have spent the past 24 hours plugging the latest figures into my mega dashboard, and in today’s edition, I’m sharing my analysis on the state of EV charging in the UK, shown helpfully with charts. Let’s dive in…
1. Last year was big. But it’s down on 2023-24.
A 27% increase in the number of chargers is a great testament to the hard work of the sector. However, that equates to just 17,370 devices being added in the 12 months to July 2025. This is 15% lower than what it was in the year before in 2023-24. Across that year, the UK networks added 20,612 devices.
In the chart below, I have broken down the rate of installations by quarter. Quite clearly, last year there was a dip. And there have been dips before. This is likely due to a) installing chargers being a pain in the a*se, with all the planning that goes with it. And b) political uncertainty, whereby many councils have sat waiting for their government funding to come through.
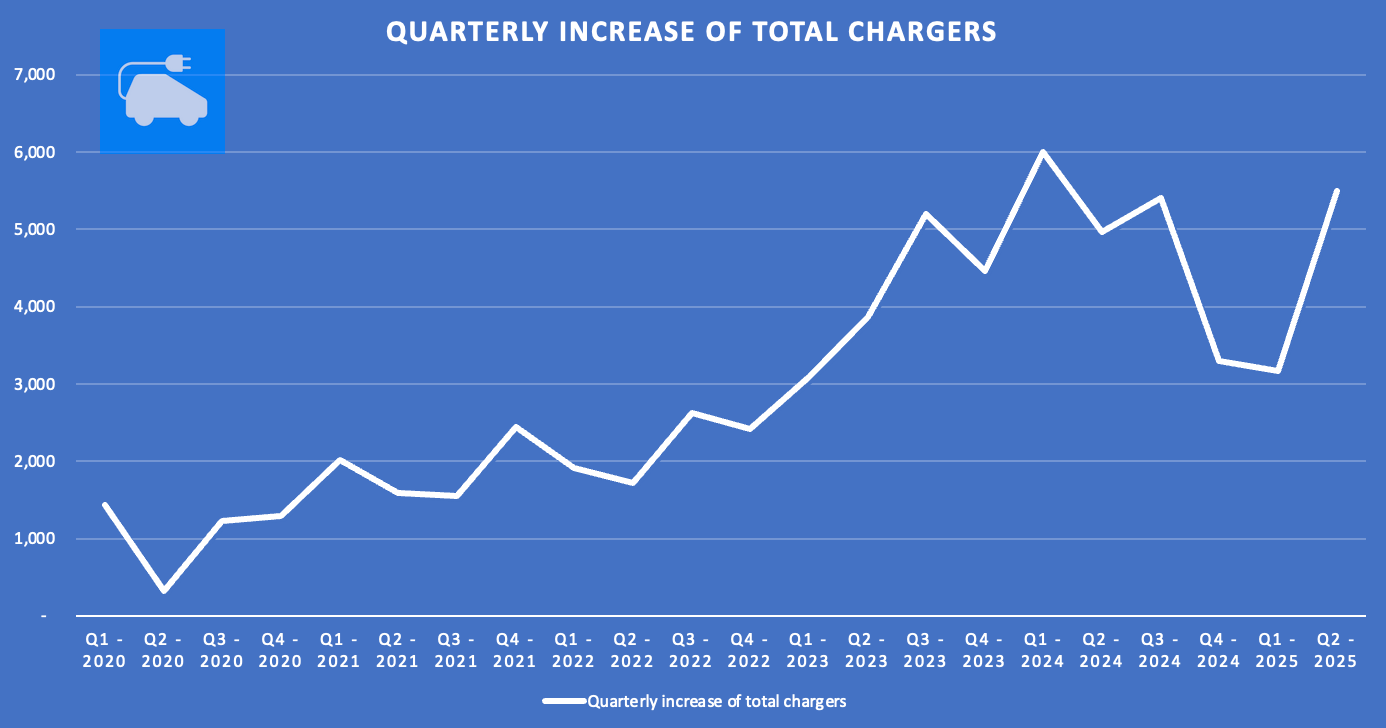
What is positive in the above is this latest quarter. It shows a real bounce upwards, nearly making it one of the strongest quarters ever. This is hopefully a trend that will now continue as more contracts come through, and generally there’s more investor positivity around the sector.
2. 150kW+ chargers are surging
A year ago, in 2024, there were 12,494 ‘rapid’ chargers. By rapid, I mean any device with a speed rating at or above 50kW. Of those, 42% were classed as ultra-rapid, meaning they have a speed at or above 150kW.
One year later, now more than half of the rapid chargers are classed as ultra-rapid. To me, the data suggests slower machines in the 50-149kW bracket are on the way out. Quicker devices are surging. In the last year, the number of installed ultra-rapids went from 5,314 to 8,612 as of this month. That’s an increase of 62%.
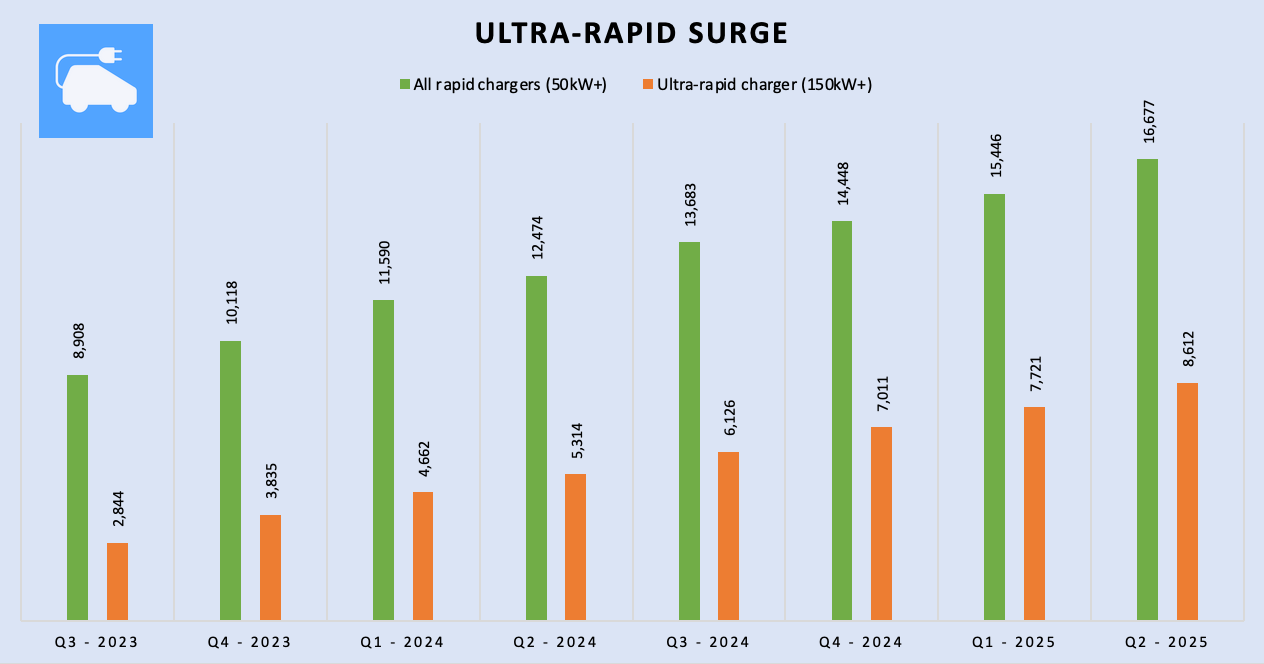
It’s perhaps no surprise that networks are favouring fast chargers, as fresh data from Zapmap on charger utilisation suggests the current EV owner population spends 69% of their time at public chargers using devices over and above 50kW.
3. Chargers are keeping pace with EV registrations
We’re forever hearing from carmakers that we need more public chargers to meet the demand of faster registrations. This is an area I’ve been tracking for a long time, using data from SMMT’s monthly updates going back to January 2019 - and before that, old DfT vehicle licensing analysis. From all that, I believe as of July, there were 1,592,530 full ‘EVs’ registered in the UK. Some may disagree, though I’m confident that’s in the right ballpark.
Anyway, now we have this figure, and all the previous ones from months behind us - we can see that the number of ‘EVs per public charger at any speed’ has remained flat since the start of 2023. Right now, there are 19 EVs for every public charger. Given that many of those 1.6 million are likely early adopters, and will have driveways, it feels like the public network is keeping pace.
However, for me at least, with this particular analysis, the most important consideration is how the rapid chargers are keeping up. Because those are devices that could be used much more realistically by all drivers, whether they have home charging or not.
Having peaked at 102 EVs per rapid charger in Q3-2023, the number has since dipped down to 95 EVs per rapid charger with the latest stats. However, with the surging ultra-rapid (150kW+) points, that looks to my eyes like a real success for drivers who won’t want to linger at hubs or motorway services.
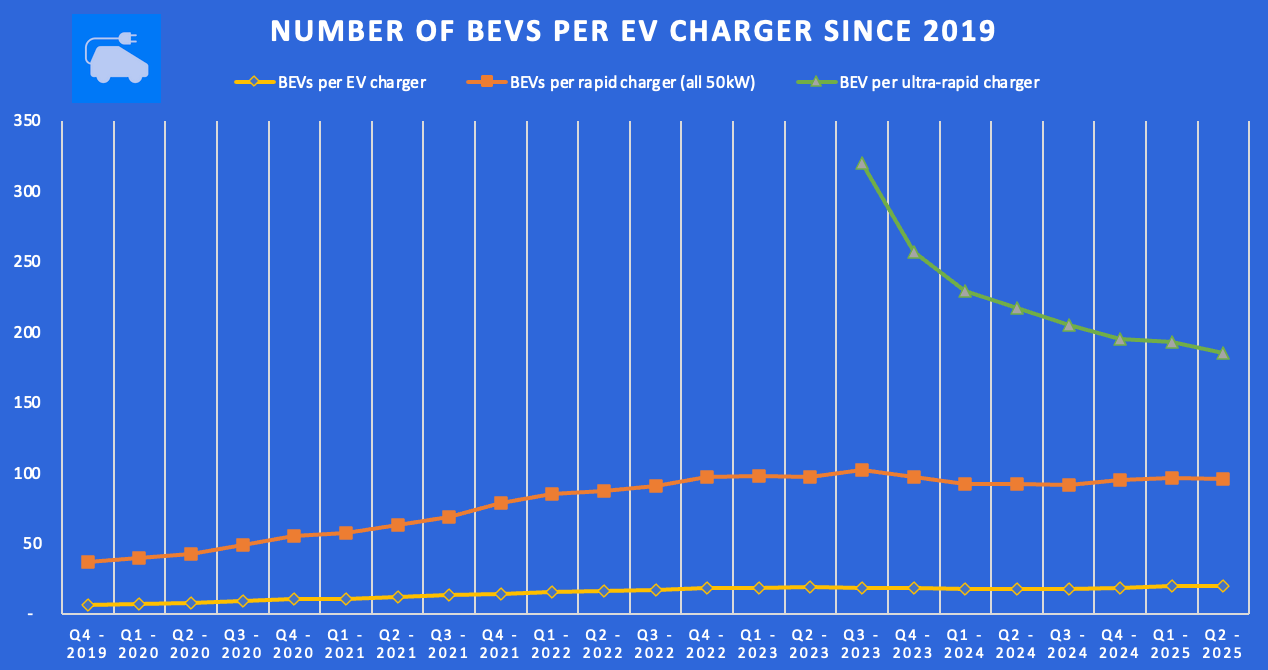
If you look at the above chart, the green line starts in Autumn 2023, which is when DfT started splitting out the number of chargers at 150kW+. Given the changing technology preference of networks, the number of EVs per 150kW charger has gone from 320 to 185 in under two years. That’s a drop of 42%, and it’s still trending down. Given that these are devices which may only be used very rarely by the real-world driver, yet are extremely visually effective, it’s a great achievement.
4. Slower on-street chargers are falling behind
Many people in this country have driveways. However, an estimated third of households do not. Most of these folks tend to live in urban areas where there just isn’t room. As we all know, that means this third of homeowners will likely have to entirely rely on public infrastructure. While the cost of public chargers is a big turn-off for people I speak to, simply the availability of kerbside or nearby on-street chargers is still a huge barrier.
One of the greatest innovations of the EV transition has been the repurposing of lampposts (which offer speeds of around 4kW). They’re very cheap and easy to install. The wiring is already there. Out of the 300,000 public chargers the UK government wants to have ready by 2030, lampposts will likely make up a large proportion.
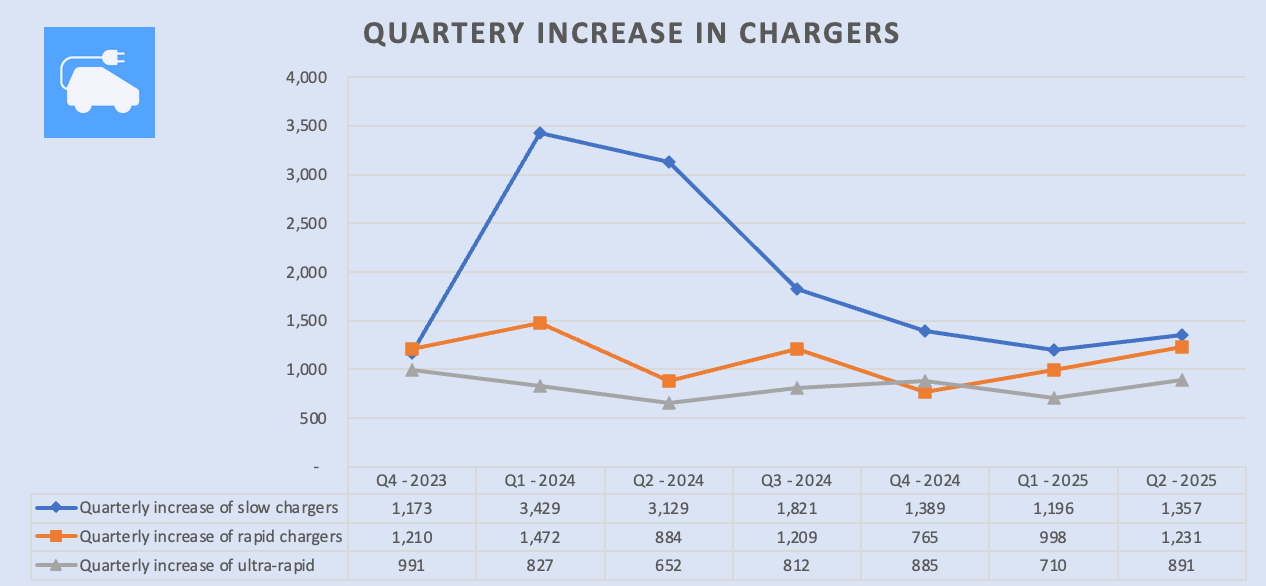
However, the data suggests installations of slow chargers - those between 3-8kW, which tend to be on-street devices like lampposts - have fallen off a cliff. In the last quarter, there were nearly as many rapid chargers installed as slow ones. Whereas this time last year, the number of slow chargers going in the ground was almost three times higher. See the chart below.
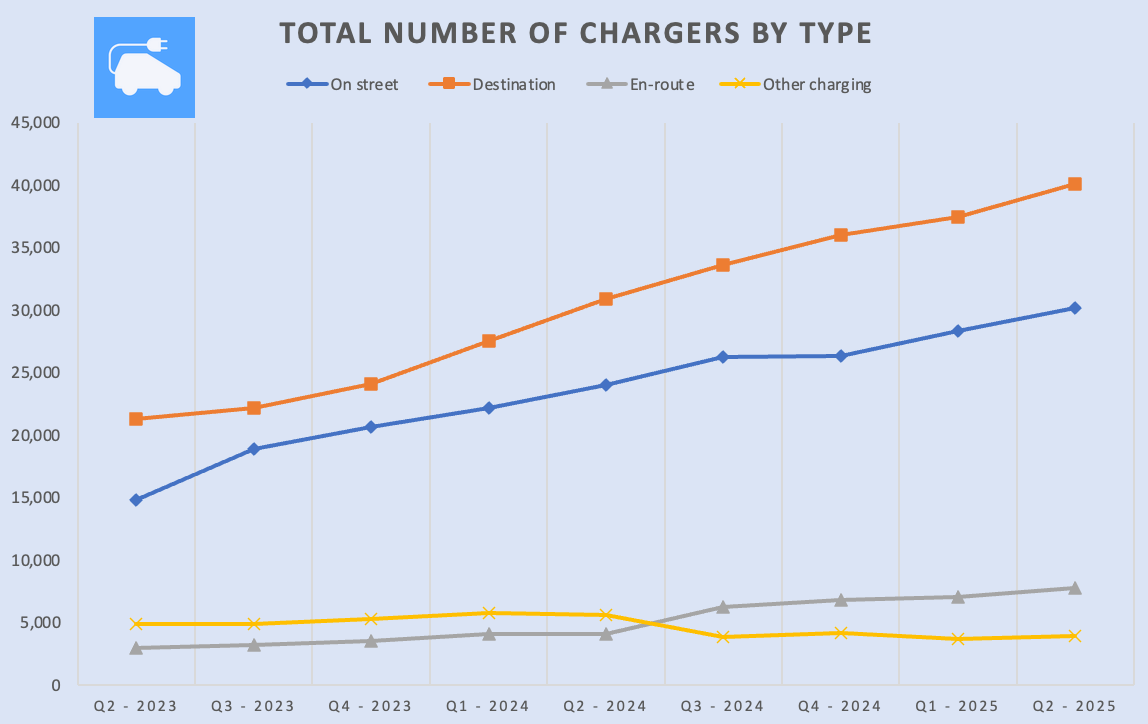
Also worrying is the pace of growth for different ‘locations’ of chargers. DfT badges all chargers as either being ‘on-street’, ‘destination’, or ‘en-route’. While in 2023-24 on-street chargers grew an average of 13% each quarter, this past year that’s dropped to 6% per quarter. That makes on-street chargers the slowest location of charge point out of the three types.
Hopefully, the fact that LEVI funding is now coming along will mean we’ll see a boom in these devices. But, right now, it does leave me a bit perplexed as to why the industry wants to prioritise ‘destination’ locations, such as with the new Bonvoycharge campaign. Especially as the number of destination chargers has, for two years, led - and is now breaking away - from the number of on-street locations.
For a sector that forever moans about the inequality of VAT on public chargers, to now want to focus instead on providing a better experience to people who can afford a UK staycation versus putting energy into supporting those who can barely break even, feels strange. I understand the arguments for destinations; they’re important, but you can’t ride more than one horse. And the horse that seems to need more help is outside people’s doors, not second homeowners.
5. Will the new grant put pressure on networks and councils?
While the new Electric Car Grant appears to have come under criticism this week for being overburdensome, once those wrinkles have ironed out, undoubtedly, we’ll see a fresh surge in purchases, especially for more affordable models. But… what impact could this have on the UK’s public charging network?
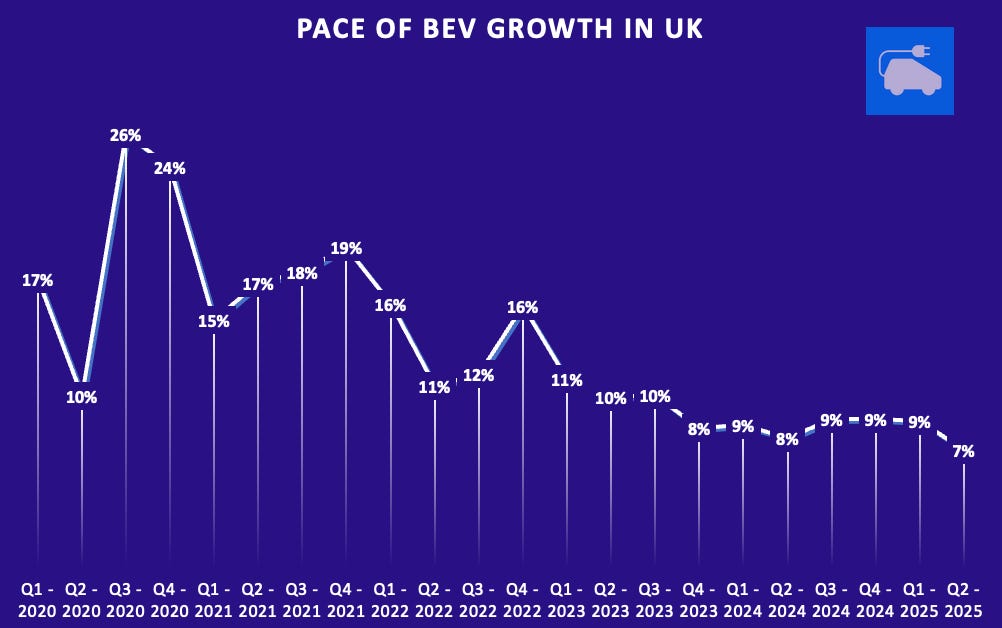
Based on SMMT’s data, the growth rate of quarterly EV registrations has slowed significantly over the past year. Albeit, the actual volume of EVs regularly now exceeds 100,000 each quarter. By comparison, back in the first half of 2022, when we last had an active grant, the country was only registering about 50,000 per quarter. But the growth rate (or, maybe let’s call it ‘pace’ of adoption) was sitting between 11-19%. In broad terms, it was about double what it is now.
Should we see that growth rate return alongside the new EV grant, what would it mean for the number of chargers we need? How will it impact the number of EVs per public charger?
I’ve run a few rudimentary scenarios on the assumption that the charging network will grow at 27% again by this time next year (so, over 104,000 chargers).
Times two. If EV registration growth doubles from the current 7% per quarter to 14%, it would result in going from the current 19 cars per charger to 21. In this scenario, to maintain the current level of 19, the network will need to expand by 37% (or add 30,341 chargers).
High growth. If EV registration growth jumps from 7% per quarter to 25% (which it hit in 2020), it would mean going from the current 19 cars per charger to 22.5. In this scenario, to maintain the current level of 19, the network will need to expand by at least 47%. This means adding 38,540 chargers, well over double the number installed during the past year.
Same level. Even if EV registration growth remains the same at 7% per quarter, it would still mean the public network needs to grow by 31% to maintain the 19 cars per charger in 2026. In this scenario, that would mean adding 25,421 devices. That’s a lot, though it certainly seems more achievable.
So… a hell of a lot hinges on the success of local authorities in deploying their new funding, and for projects to get underway sharpish.